Hello Everyone!
In the beginning, your support means a lot to us and encourages us to continue so Thanks for all support you provide.
Today we are on a date with the publication of another BTC update on the main page. our last update on the main page was published 40 days ago but below it we continuous updates, the last of which was a few days ago you can take a look there.
25 Oct 2021 we shared this article with you here on Tradingview, it was talking about movement scenarios and some trading tips, etc. we would you to take a look from here .
Related to the last update below the main article we posted on 10 May!
In the Previously weekly update !
a few days ago Bulls succeed to reach $32K for a very short time before returning below $29K levels again and left a long wick on the weekly time frame which expresses how bears are still strong and do not allows to bulls to take the lead this fast and how bulls still far to reverse the trend and being bullish again.
for short-term movement, bulls need to push prices again above $32K with the daily or weekly close followed by a breakout for $34/ 36K and this will not be counted as a trend reversal, this just shows the bulls are still with us on market.
for the long-term, the Bulls need to breakout $45K/$47K and this will be a good step from the bulls and shows their willingness to take the lead.
for now, the market is still in a bearish trend and targeting $22/18 as long as nothing from these bullish steps happens yet.
New weekly update!
What an exciting week full of endless events
🕵️♂️Current movement:
As you can see clearly it was a bloodbath week, bears make BTC rekt not to $22/18k as we explained in last update but BTC gets $175XX which means about -75% from ATH, During that week we were trying to keep you updated with daily posts about movement etc, but we are not here to mention something and said it goes as what we expected we were right. we are here to give you an update about market movement and how we see it, maybe you agree maybe not, but at least you are not bound by anything mentioned here,
This week BTC drop below MA 200 and 2017 ATH as well since Dec 2021, So do we will see BTC stop and take their breath or we will see another LUNA collapse here!
if you ask us about that we will say everything is possible but let us read what the chart says!
📖 The Chart Tells Stories!
if you compare previous cycles for BTC and the current dump you will see BTC down by -75% which means BTC still has some dip if we are going by -93% / -85% / -84% as in previous cycles! which means $13k and $5K/$3K in the range! if BTC repeats what happen before!
this update show kind off about the previous cycle is not the best analysis but it might help you can take a look from here
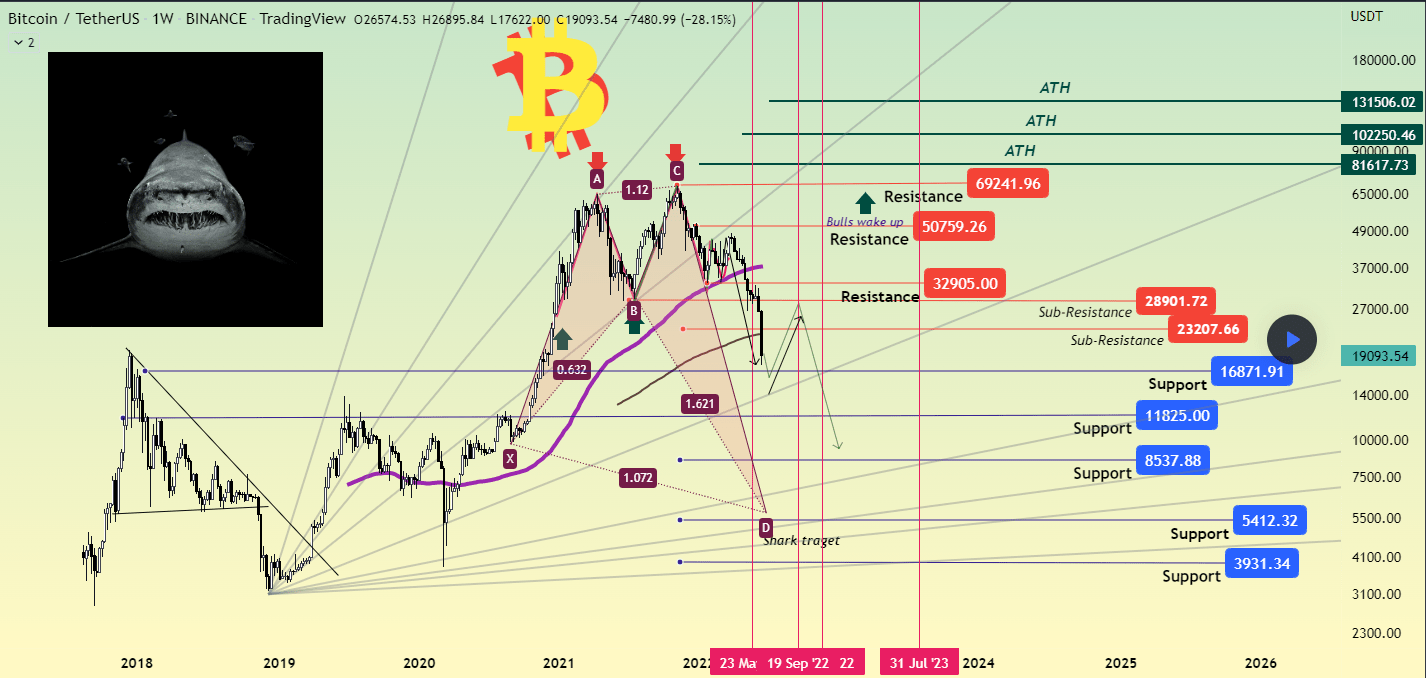
🤔 What After $17K,
Previously we said we looking for a rebound to 25/28/30k from the $22/19K zone based on the last view on the weekly update we shared, and set this term for more bearish movement which said if BTC closed below $19K Daily/weekly, in this case, we will see prices reaching $16 / $13 / $9K around MA 300 and lower about -85% from ATH at 69K.
Yeah BTC closed below $19K and hit $175XX with the rebound to $19K
Probably The third quarter of the year will make bears lose some momentum and BTC will be between some rebound and slow movement before the last drop to $13k /$5K at the end of the year that extends to the first quarter of 2023. so we might see BTC ranging between $18k / 23 / 28K before going to $13K!
Based on the trading plan we shared, we already have limits at these levels, and we see a fast dump will be better than a boring recession.
🎬Current action:
we have an entry average of around $19850 and a trading plan we shared with you as well so we will stick with both and if there is something new we will update you.
Major resistance levels 📈
$28/$32 CME gap and work as retracement targets as well
$36/40k first resistance line reclaiming it weekly = bulls send a message.
$45K/$47k. resistance area reclaiming it = bulls are here
$50/55K. reclaiming weekly = Bulls back to revenge
$65K. weekly close = new ATH around $75K/83/95K
Major Support levels 📉
time to mention these levels which we avoided whole this time to not make people panic!
$17500 $15500 Q3 support
$13000 -82% for BTC from ATH ( previous cycle dip)
$9500 old CME GAP ( market rekt)
$5500 ( people disbelief)
$3200 ( smart money comes) – Saylor’s MicroStrategy out
$1500 Saylor arr***ed or kil***g himself.
the levels we mentioned above will make some people terrified, and some people attack us but be sure we are normal people we don’t know the unseen or have crystal balls, and we may be right or wrong.
The point of mentioning these levels is to make you ready, not spread fears, the point is to make you stick with risk management, we do not tell you this is the bottom and fomo you with X100 to rekt easily, and not FUD you as well, we telling you to stick with risk management and review your plan that’s all.
important dates for BTC !! 👀 let us watch the Bulls&Bears performance on these dates:
Update Previous Dates
7 June Was pump and dump day BTC loss&got -7% this day was price action followed by – 44% for BTC
10 June Breakdown $29K support – 40% for BTC
14 June mixed day between +/- 7% BTC hit 20K first time since Dec 2020
Incoming Dates
21 June
27 June
3 Jul
7 Jul
13 Jul
Ps:
These dates do not tell you to buy or sell, but you can use it in your TA as a time factor for patterns, trends, etc.
Remember,
The person who is obsessed with bullish thought can extract 10000 scenarios for bullish movement and the same with a bearish person. for us, we extract both sides and we define the best buy /sell zone and trade based on that, and what we care about is what happens.
As analysts, we have to explain both bullish and bearish directions, and if there is a chance to give a personal prediction for the next movement we will do as like previous analyses. Also, you do not have to worry about what or how i think, but you have to worry about what is happening and what you can do based on it. So, Be bullish or bearish as you want, But be sure you cannot impose what you want or force it to happen. so be ready for everything.
Ps:
We don’t short btc
Our view might be right or wrong, so be sure to do your own research. Following any signal or any update we share is your decision and at your own risk.
Share a trade or take scalping entry does not mean any change on our TA view, if there is something new we will share that on a new TA post.
This is not financial advice, The purpose of these Charts is to give you an idea about coin movement (not buy or sell signal) so before following any idea be sure to do your own research, and follow your risk management. Also, the information we mentioned here is a personal effort that is subject to success or failure and we welcome constructive criticism. Remember that the Cryptocurrency market is very volatile and not suitable for everyone, so be aware of what you will do before you start.
Good luck to all.
🙏we ask Allah reconcile and repay🙏