Hello Tradingview community and dear followers, welcome to our first BTC update of 2023 on the main page.
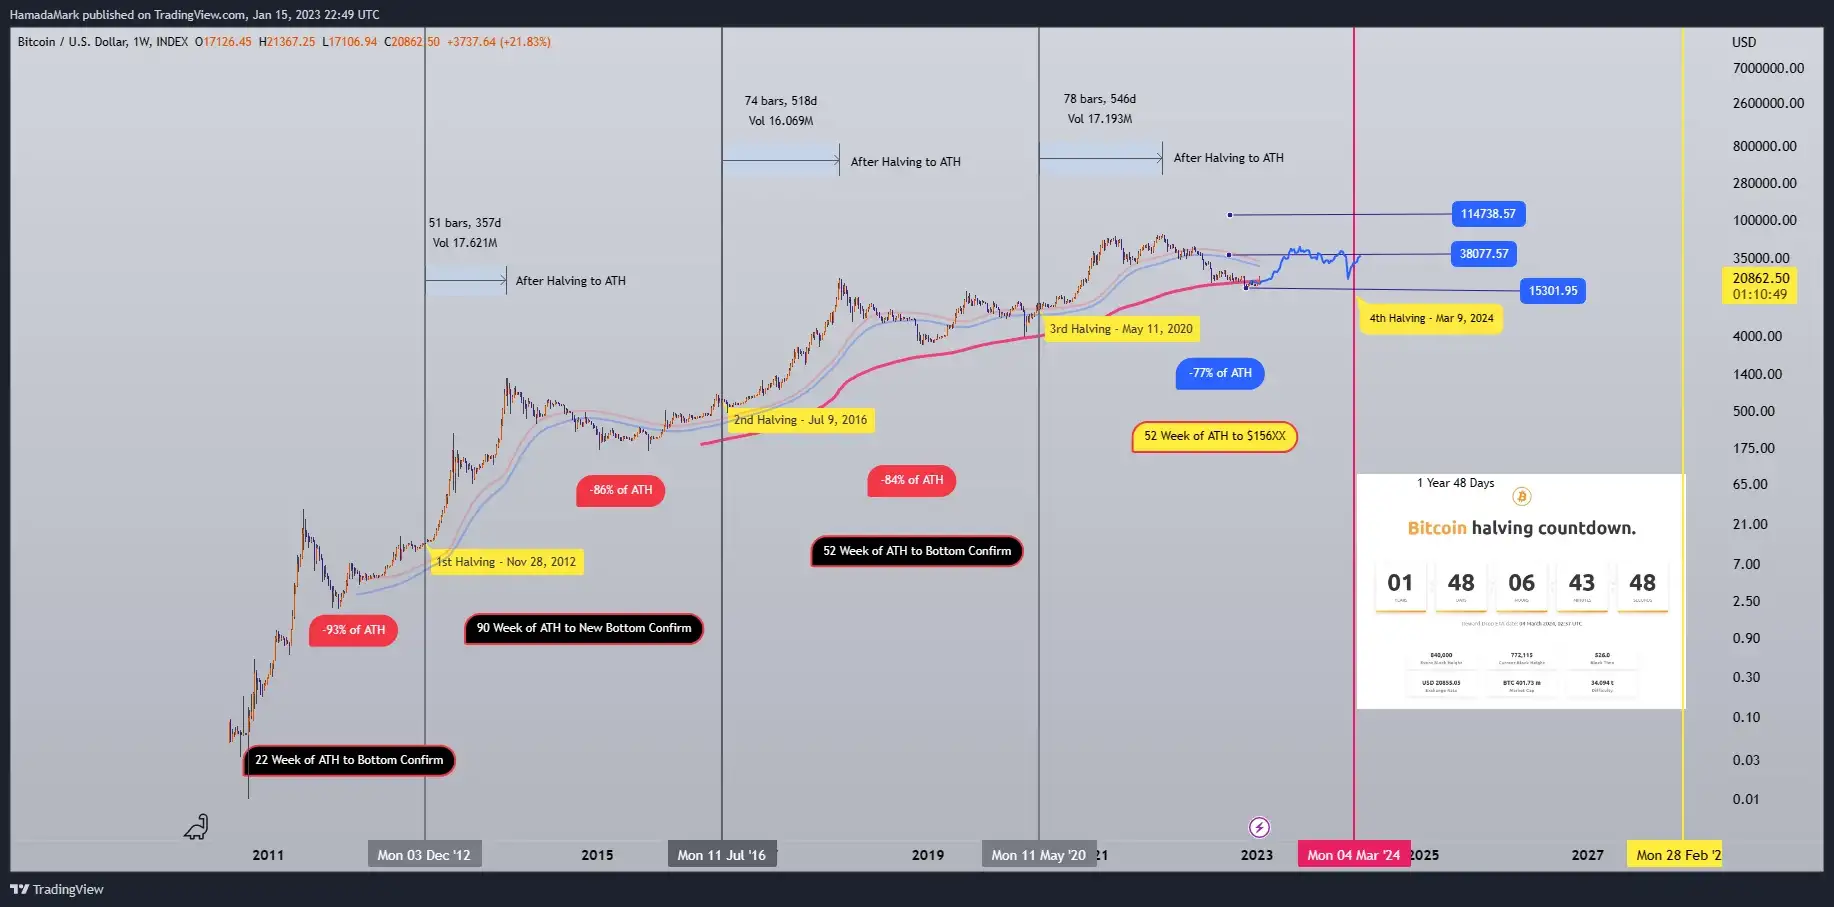
after a period of stagnant market and a decline of more than 75% from its all-time high of $69,000 to $15,400 ( BITSTAMP prices) over the last 13 months. finally, we have seen BTC show signs of recovery at the start of 2023, with gains of 28% so far, after a period of a stagnant market. This leads us to the main question on many traders’ minds: Is BTC’s rise a new bull run or just a temporary rally?
Please note that the information presented here is based on the writer’s opinion and should not be taken as a guarantee of future performance. It is intended for informational and educational purposes only not financial advice.
Based on our chart analysis and comparison of BTC’s movement after BTC halving, we can see that the data is interesting. Even though this downward cycle is happening at a different rate than previous cycles, we can extract some insights.
On the bullish side,
BTC has a chance to establish $15,XXX as the bottom and start a new bullish trend until the next halving and the formation of a new all-time high.
For this to happen, BTC needs to hold above $15,000 and break out to $27,000 in the coming weeks during Q1 of 2023. If this occurs, we may see BTC continue to move up to $32,000/$37,000, making this year a green year until Q2.
Then, a final correction to $21,000/$18,000, followed by the Bitcoin halving to create a clear path to a new all-time high of around $100,000. However, it’s important to keep in mind that these predictions are based on the current market conditions and are subject to change. It’s important to stay informed and use a combination of technical and fundamental analysis to make informed decisions.
On the bearish side,
if BTC fails to break out above $24,000/$27,000 in the next weeks and falls back below $17,500, it could lead to another panic sell-off, resulting in further losses for bulls. This could potentially push BTC down to $15,000/$13,000/$10,000, which is a possibility that some traders have been anticipating and we were on of those people.
Our personal view,
based on the current performance, the bulls appear to be doing well and have a good chance to break out above the last high of $22,000. This would be a positive sign for a trend reversal. However, until that happens, we are not fully bullish yet. Nevertheless, we have been taking advantage of the movement by sharing some signals at $15,800/$16,300/$16,700 which are currently yielding good gains.
We believe that the bottom is only confirmed when a trend reversal occurs and not before. During the period before a trend reversal, a potential bottom can be identified, and trading can be done based on that potential with strict risk management in place.
PS:
The person who is obsessed with bullish thought can extract 10000 scenarios for bullish movement and the same with a bearish person But As analysts, we provide both bullish and bearish scenarios, highlighting potential buy and sell zones. However, it’s up to the trader to conduct their own research, use caution, and make informed decisions. Keep in mind, the market is unpredictable, and having a bullish or bearish bias doesn’t guarantee a certain outcome. Please note, we do not short BTC , and our predictions may be right or wrong and this is not financial advice.
Please keep in mind that this is not financial advice and the purpose of these charts is to provide an idea of coin movement, not buy or sell signals. The cryptocurrency market is highly volatile and not suitable for everyone, so be aware of the potential risks before making any investment decisions. The information presented here is a personal effort and is subject to success or failure, and we welcome constructive criticism.
Good luck to all.
🙏we ask Allah reconcile and repay🙏
Comment (1)
google travel / December 2, 2025
Your means of describing everything in this post is truly good, every one can simply be aware of it,
Thanks a lot.